Press Room
LexisNexis Insurance Demand Meter Registers as “Nuclear” for New Policies and “Sizzling” for U.S. Auto Insurance Shopping
in Q1 2020
05/17/2023
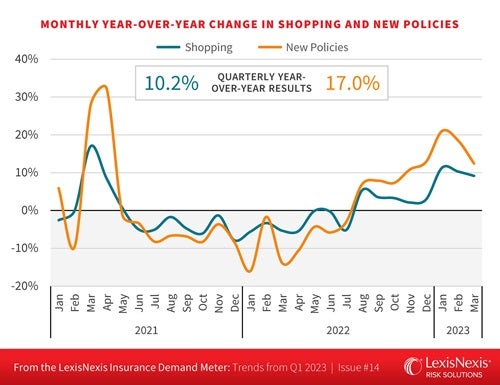
ATLANTA — The latest edition of the LexisNexis® Risk Solutions Insurance Demand Meter reports the quarterly year-over-year U.S. auto insurance shopping growth rate rose 10.2% in Q1 2023, up from +2.8% growth in Q4 2022 as auto insurers continue to implement widespread rate increases. New policy growth, or the rate at which consumers either switched or purchased new coverage, continues to be a big story. It was up a staggering 17% for the quarter compared to Q1 2022, and also increased from 10.2% growth in Q4 2022, continuing the record upward streak from November 2022.
“We’re still seeing record-high shopping activity and new policy purchasing as auto insurance rates continue to soar,” said Adam Pichon, senior vice president of Auto Insurance and Claims at LexisNexis Risk Solutions. “We are starting to see some stabilization in the market, however, with claim frequencies flattening out the last few quarters and severities rising at a slower clip. But until claims severity levels off and vehicle sales begin to rise again nationwide, it is likely insurers are going to continue to take rate, so we do expect to see shopping activity remain volatile at least into the next quarter as insurers grapple with macroeconomic conditions.”
Record-breaking shopping: who is shopping where, and how are vehicle sales impacting auto insurance rates and shopping?
In January, the exclusive and independent agent (IA) distribution channels saw 12% growth, with the IA channel growing by 11% in February and 9% in March. By comparison, the exclusive channel slowed to 5% growth by the end of the quarter. In the direct channel, growth in January was modest, but ended at a whopping 17% by the end of March.
The rate at which shoppers switched or purchased coverage was up across all demographics, continuing the trend from Q4. Early in the quarter, the 36-45-year-old age group accounted for strong growth, but that reversed to more traditional patterns in mid-February as older shoppers began to outpace younger shoppers. As noted last quarter, older age demographics, especially those in the 55-65-year-old group that have not historically shopped at a high rate and were not likely to switch when they did shop, are now shopping and switching at an accelerated pace.
“Vehicle sales, especially drops in purchases of used vehicles, are still playing a key role in the dramatic increases in shopping as vehicle purchases are closely aligned to shopping and switching events,” said Chris Rice, associate vice president of strategic business intelligence at LexisNexis Risk Solutions. “Shopping that pertains to a vehicle sale held steady at around 27% for new vehicles and 36% for used, but the downtick in vehicle sales overall caused a drop in all shopping attributed to vehicle purchases, which can naturally lead to premium increases and more shopping and purchasing in each of the aforementioned age demographics.”
“Another key factor to keep in mind is that Q1 is when we typically have seen a boost in shopping due to the Earned Income Tax Credit,” continued Rice. “After relatively muted tax season shopping the past two years when the federal government distributed those credits earlier than normal, we saw more of a return to the norm in Q1 as those tax credits hit consumers’ wallets during the traditional time period we normally see.”
A Look Ahead
Coming off of 2022’s high shopping volumes, there is a possibility that the second half of 2023 could see a slowdown in shopping growth trends. Multiple factors will be at play in the coming months as insurers keep a close eye on claims severity and frequency, as well as the potential for changing economic conditions and the related impact on new and used vehicle sales. Still, in the near-term, Pichon said to expect more rate-taking in Q2 from insurers, which could lead to continued shopping volatility.
“Insurers are more likely to continue taking rate until claims cool down, but vehicle sales are something to watch very closely for the remainder of 2023,” said Pichon. “If claims severity and frequencies continue to level out and economic conditions improve to the extent that more cars become available for purchase and consumers have the means to do so, we very well may see the shopping growth pendulum begin to tick back to more normal levels. We’re at a bit of an inflection point in the market, and the second half of 2023 can provide opportunities for insurers who are leveraging data and analytics to more effectively assess risk and address profitability head on.”
Download the latest Insurance Demand Meter.
About the LexisNexis Insurance Demand Meter
The LexisNexis Insurance Demand Meter is a quarterly analysis of shopping volume and frequency, new business volume and related data points. LexisNexis Risk Solutions offers this unique market-wide perspective of consumer shopping and switching behavior based on its analysis of billions of consumer shopping transactions since 2009, representing nearly 90% of the universe of insurance shopping activity.
About LexisNexis Risk Solutions
LexisNexis® Risk Solutions leverages the power of data, advanced analytics platforms and integrated AI solutions to provide insights that help businesses across multiple industries and governmental entities reduce risk and improve decisions to benefit people around the globe. Headquartered in metro Atlanta, Georgia, we have offices throughout the world and are part of RELX (LSE: REL/NYSE: RELX), a global provider of information-based analytics and decision tools for professional and business customers. For more information, please visit LexisNexis Risk Solutions and RELX.
Media Contacts
Sr. Director, Communications
Insurance and Connected Car and Coplogic Solutions
[email protected]
+1.678.896.1463