Bodily Injury loss costs are rising in US

Bodily Injury loss cost trends continue to rise…..is another surge coming?
At the outset of the pandemic, the personal auto insurance industry experienced strong and sudden increases in Bodily Injury (BI) severities, driven predominantly by faster driving speeds coupled with increased social inflation both of which influenced claim outcomes simultaneously. As the chart below shows, those increases were followed by more than a year-long period (July 2020 – Sept 2021) where severities were down or flat. What we saw from the end of 2021 into the second half of 2022 was consistent upward pressure on BI severities that added another 15% increase in that time. Overall, BI severities have risen 40% since the start of 2019.
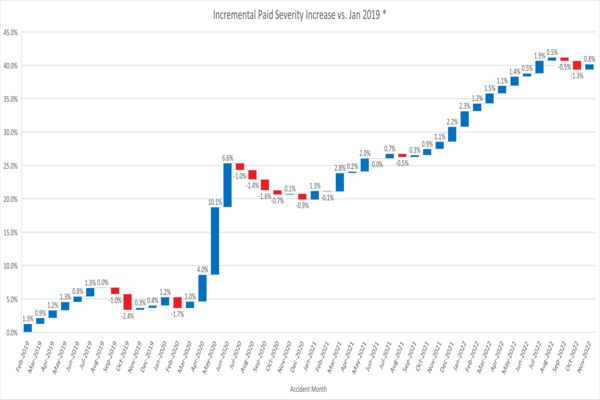
* Rolling 3-month average; severities based on what was paid within 180 days after the loss occurred
Source: LexisNexis® Risk Solutions internal data
Bodily Injury Frequency
These severity increases were offset by lower loss frequencies that were still 15% below January 2019 levels (reported basis) to start the year. January 2023 was a significant jump up from January 2022, indicating a slow creep back towards pre-pandemic frequency levels has continued in 2023.
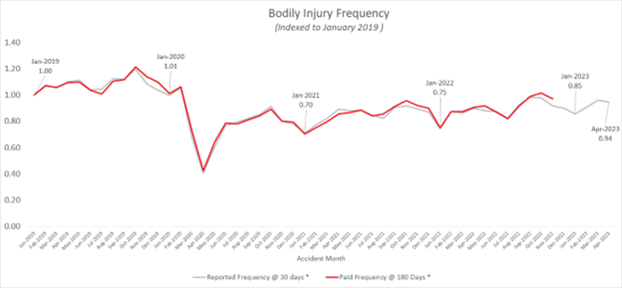
* Reported losses evaluated at 30 days and paid losses evaluated 180 days after the loss occurred
Source: LexisNexis® Risk Solutions internal data
Bodily Injury Pure Premium
What is the combined impact of these severity and frequency trends on BI loss costs (pure premium)? Through November of 2022, loss costs were up 36% compared to January 2019. If paid frequencies continue to follow reported frequency patterns as they have throughout the last four years, then paid loss costs for April 2023 will end up 32% above January 2019 levels. This also assumes paid severities remain flat.
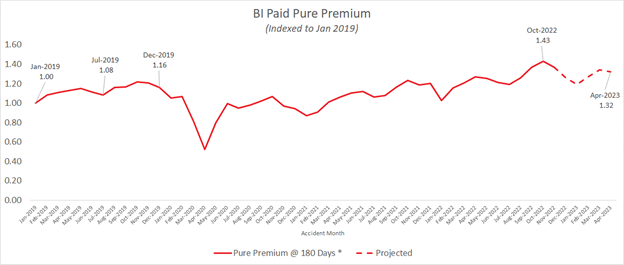
* Paid losses evaluated 180 days after the loss occurred
Source: LexisNexis® Risk Solutions internal data
Geographic Trends
Looking at BI frequency and severity trends geographically, how these trends are playing out in individual metro areas varies widely. Here is a snapshot of the frequency and severity trends we are seeing in select metropolitan areas across the country.
| Metro Area (MSA) | Reported Frequency y/y (YTD December 2022) |
Paid Severity y/y (YTD Nov 2022) * |
| Los Angeles-Long Beach, CA | 23.1% | 6.7% |
| Washington, DC-MD-VA-WV | 7.1% | 7.7% |
| Atlanta, GA | 6.5% | 9.2% |
| Houston, TX | 11.0% | 11.1% |
| Miami, FL | 20.4% | 8.8% |
| Phoenix-Mesa, AZ | 2.7% | 17% |
* Evaluated at 180 days after loss