Crash Mapper and Dashboards
Visualize critical traffic-safety issues and trends within seconds
Crash Mapper and Dashboards

Crash Mapper and Dashboards
Included with LexisNexis® eCrash and LexisNexis® BuyCrash™ solutions, Crash Mapper and Dashboards aggregate, analyze and automatically transform your crash data into a force multiplier enabling agencies to:
Quickly identify and correct traffic safety issues
- Pinpoint where, when and why accidents happen
- Intelligently deploy patrols based on peak or recurring activity
- Access detailed crash statistics to support federal grant applications or special initiatives
- Provide targeted, near real-time data for neighborhood meetings and Command Staff reviews
Access Sales Sheet Here
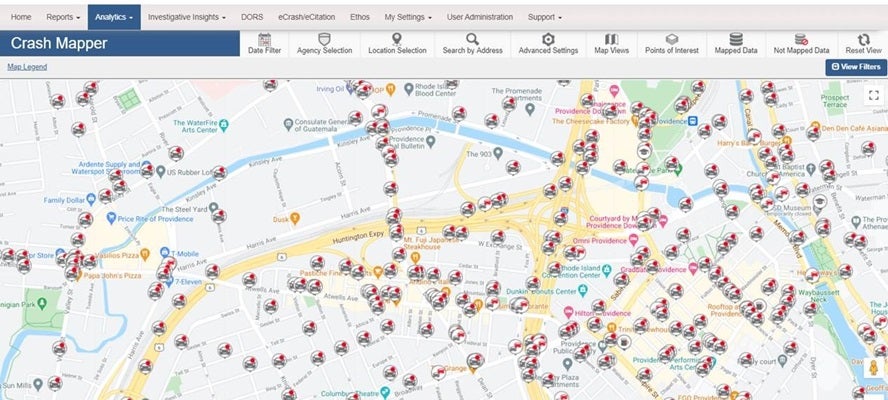
Crash Mapper
 |
Switch from street views, satellite views, heat maps and points overlay. |
 |
Zoom in and out of maps and hover over specific location for details |
 |
Map based on longitude/latitude in report |
 |
Filter by date, injury type, crash city location, day of week and more |
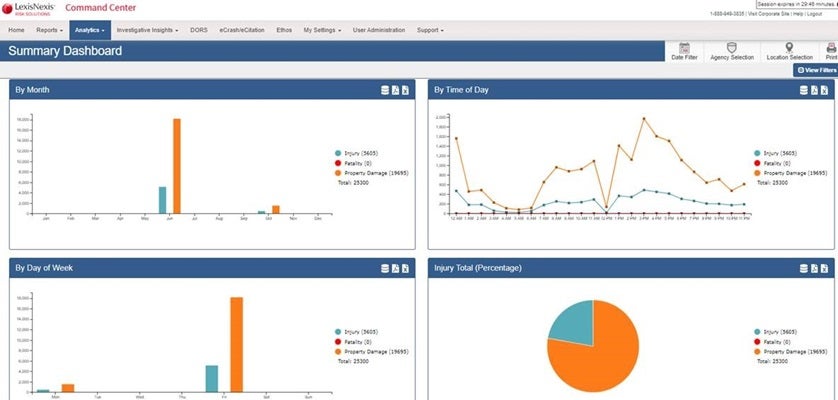
Dashboards
 |
View multiple dashboards including Summary, Causation,
Teen and Elderly views. agencies that submit paper crash reports |
 |
Modify views and illustrations by simply selecting
or deselecting legend values |
 |
Download charts and graphs in PDF or Excel formats or
choose a “quickview” of data in table format |
 |
Build at-a-glance views of mission-critical crash statistics
including crash counts and categories including alcohol, weather and more |
The Crash Mapper and Dashboards, eCrash and BuyCrash services are not provided by “consumer reporting agencies,” as that term is defined in the Fair Credit Reporting Act (15 U.S.C. § 1681, et seq.) (“FCRA”) and does not constitute “consumer reports,” as that term is defined in the FCRA. Accordingly, the Crash Mapper and Dashboards, eCrash and BuyCrash services may not be used in whole or in part as a factor in determining eligibility for credit, insurance, employment or for any other eligibility purpose that would qualify it as a consumer report under the FCRA. Due to the nature of the origin of public record information, the public records and commercially available data sources used in reports may contain errors. Source data is sometimes reported or entered inaccurately, processed poorly or incorrectly, and is generally not free from defect. This product or service aggregates and reports data, as provided by the public records and commercially available data sources, and is not the source of the data, nor is it a comprehensive compilation of the data. Before relying on any data, it should be independently verified. LexisNexis and the Knowledge Burst logo are registered trademarks of RELX Inc. BuyCrash is a registered trademark and Coplogic is a trademark of LexisNexis Coplogic Solutions, Inc. Other products and services may be trademarks or registered trademarks of their respective companies. Copyright © 2024 LexisNexis.
Discover data sophistication and the solutions to support your journey to fewer crashes
Coplogic™ Data Sophistication
Advance your traffic safety strategy from reactive to proactive to preventive by improving your level of data sophistication.
Coplogic™ Ethos
Improve officer satisfaction with native mobile field-based reporting and enable comprehensive real-time data and analytics.
LexisNexis® BuyCrash®
Build relationships through faster crash report delivery and transparency enabled by crash data and analytics visualizations.