Press Room
LexisNexis Risk Solutions Releases New Index to Gauge Trends in Auto Insurance Shopping
03/31/2020
ATLANTA — LexisNexis® Risk Solutions today announced the launch of its new Insurance Demand Meter, which tracks automotive insurance shopping activity on a quarterly basis. The meter provides insurance carriers with valuable data to help benchmark their customers’ auto insurance shopping volumes and patterns to those of the industry. With a more thorough understanding of how the economy, macro trends and current events impact consumer insurance shopping habits, carriers can identify unique insights and opportunities to strengthen their acquisition and retention strategies in order to gain a competitive advantage.
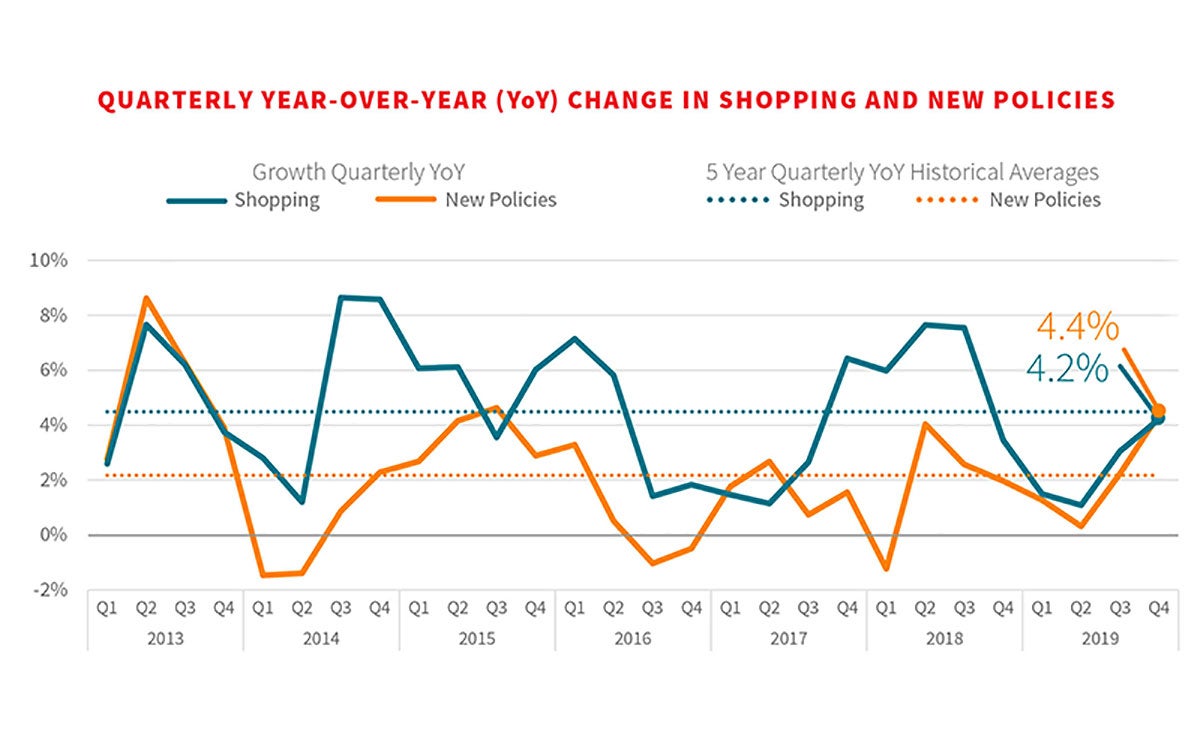
According to the latest Insurance Demand Meter, the auto insurance industry saw more shopping in 2019 than any year on record, with 2.4% growth in shopping events over 2018. This growth was driven largely by an uptick in shopping in the second half of 2019, with a 4.2% recorded growth rate in Q4 2019. The growth rate for new policies written also increased in Q4 (4.4%), outpacing the growth in shopping for the first time since mid-2017.
“Historically, similar increases in quarterly shopping activity have often been associated with continued growth for ensuing quarters,” said Tanner Sheehan, associate vice president of auto insurance at LexisNexis Risk Solutions. “However, we anticipate that the Coronavirus pandemic could counter recent growth, and we are already beginning to see signs that this is happening. Next quarter’s release of this report will provide an initial read of its impact.”
The quarterly meter and corresponding report is based on an analysis of 6.5 billion consumer shopping transactions, representing nearly 90% of all auto insurance shopping and switching transactions and is useful to insurers who want to benchmark their own quarterly shopping data against that of the following:
- Annual Shop Rate: Percentage of households that have shopped their insurance.
- Shopping Volume Index: The volume of unique shoppers relative to 2012.
- New Business Volume Index: The volume of new policies written relative to 2012.
“Our Insurance Demand Meter is the most comprehensive view of shopping in the auto insurance market, leveraging billions of shopping transactions combined with our unique insight into auto coverage,” said Chris Rice, senior director of data science for insurance at LexisNexis Risk Solutions. “Our advanced linking technology, LexID® unique identifier and deep industry knowledge also enable us to dedupe and normalize the data to provide our insurance customers with accurate and actionable insights to inform their business strategies.”
The Insurance Demand Meter will be published quarterly. To download the Q1 2020 report, which highlights trends from Q4 2019, click here.
About LexisNexis Risk Solutions
LexisNexis® Risk Solutions harnesses the power of data, sophisticated analytics platforms and technology solutions to provide insights that help businesses across multiple industries and governmental entities reduce risk and improve decisions to benefit people around the globe. Headquartered in metro Atlanta, Georgia, we have offices throughout the world and are part of RELX (LSE: REL/NYSE: RELX), a global provider of information-based analytics and decision tools for professional and business customers. For more information, please visit LexisNexis Risk Solutions and RELX.
Media Contacts
Chas Strong
Director, Communications
U.S. Insurance
charles.strong@lexisnexisrisk.com
+1.706.714.7083